
Dropbox, Evernote, and SurveyMonkey are just a few of the hundreds of companies that utilize freemium business models, a pricing strategy through which a product or service is offered for free, but users must pay to access additional features or services.
Companies with these business models often see long consideration lags (i.e. the time period between when users register for the free version of a product and when they convert as paid users). This environment can make it challenging to measure the performance of ad campaigns.
In an ideal world, you’d be able to track all registered users through each step in the purchase funnel. In your database of registered users, you could segment by paid channel (i.e. Facebook, Google, YouTube, etc.) or non-paid channel to calculate your free-to-paid conversion rate, average conversion value, and LTV. Then you could segment out by paid channel vs. non-paid channel, because the values may differ.
What we’ve seen, though, is most companies’ tracking is not that granular, and they aren’t tracking all the way through the funnel. Tracking also breaks down often when users click on an ad, register, and then convert to paid plans days or weeks later through either the same device (with their cookies cleared) or a different device. Even if an ad platform’s tracking is airtight through the funnel, a long consideration lag may exceed the platform’s max attribution window.
If these issues apply to your business, you need an alternative method to measure the performance of your ad campaigns. How would you make sense of a hypothetical ad campaign that spent $950 and resulted in 24 registrations and 11 paid users? An overall CPA metric doesn’t make sense because you’d be grouping free and paid users, which do not have equivalent values. If you apply the same numerator ($950) to each conversion type – i.e. $950 / 24, or $950 / 11 – then your reporting is incomplete and conservative.
To address this dilemma, imagine you are an online publisher with a metered paywall that allows users 30 free articles before they must subscribe to access premium content. The time it takes users to consume that much free content varies – and some users register and pay on the same visit – but it takes the average registered user 35 days before they reach their free content limit. As such, Facebook’s 28-day attribution window is not particularly useful.
This is what else we know about your business:
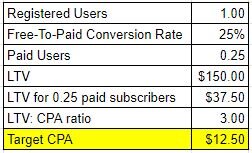
- Avg. free-to-paid conversion rate for registered users: 25%
- Avg. conversion value: $25
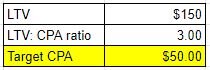
- Avg. LTV: $150 (i.e. average subscriber stays for 6 months)
Also, given these data points, you’ve decided to set the following CPA targets based on your target 3:1 LTV-to-CPA ratio:
- Registered user target CPA: $12.50 [1]
- Paid user target CPA: $50.00 [2]
Using this data and the ad campaign performance results, we can determine if our ad performance is within our targets.
- Ad spend: $950
- Registrations: 24
- Paid users: 11
- Max ad spend target: $850 [3]
- Actual CPA (blended): $27.14 [4]
- Target CPA (blended): $24.29 [5]
As you can see, your campaigns overspent by $100.00 (or by $2.85 on a blended per-conversion basis). Not awful, but not within your predetermined guardrails. [6]
This scenario illustrates why it’s so important to pass back conversion data into your ad accounts and Google Analytics. While your overall average conversion value is $25.00, perhaps in this campaign, your paid users sign up for a higher percentage of annual plans vs. monthly plans, raising the avg. conversion value (and avg. LTV). This would change the amount that you’re willing to spend to acquire these users.
Also, with segmented data, you could evaluate the free-to-paid conversion rate by cohort, and you may learn that registered users acquired via Facebook or other paid channels convert to paid users at a 38% rate (compared to the overall avg. of 25%). That would change the math considerably.
In the absence of this data, though, we advise businesses with freemium models to use these calculations to make sense of ad campaigns that yield both registered and paying users.
[1] Calculation:
[2] Calculation:
[3] This represents the most you are willing to buy this group of registered users and paid users for. We use this formula:
- (Registrations * Target CPA on registrations) + (Paid users * Target CPA on paid users)
- Resulting in: (24 * $12.50) + (11 * $50.00) = $850
[4] This represents how much you actually spent to buy this group of registered users and paid users on a per-conversion basis. We use this formula:
- Ad Spend / (Registrations + Paid Users)
- Resulting in: $950 / (24 + 11) = $27.14
[5] This represents the most you are willing to buy these registrations and paid users for on a per conversion basis. We use this formula:
- Max Ad Spend Target / (Registrations + Paid Users)
- Resulting in: $850 / (24 + 11) = $24.29
[6] If you follow this approach, be 100% certain that users who register and then convert to paid plans later (i.e. not on the same visit that they registered) are NOT being accounted for in your ads dashboard. To be certain, test when your conversion pixels fire.